Category: Uncategorized

  • Carbon Reporting: When Estimates Are Enough

    Carbon Reporting: When Estimates Are Enough

    How should companies manage carbon reporting estimates?

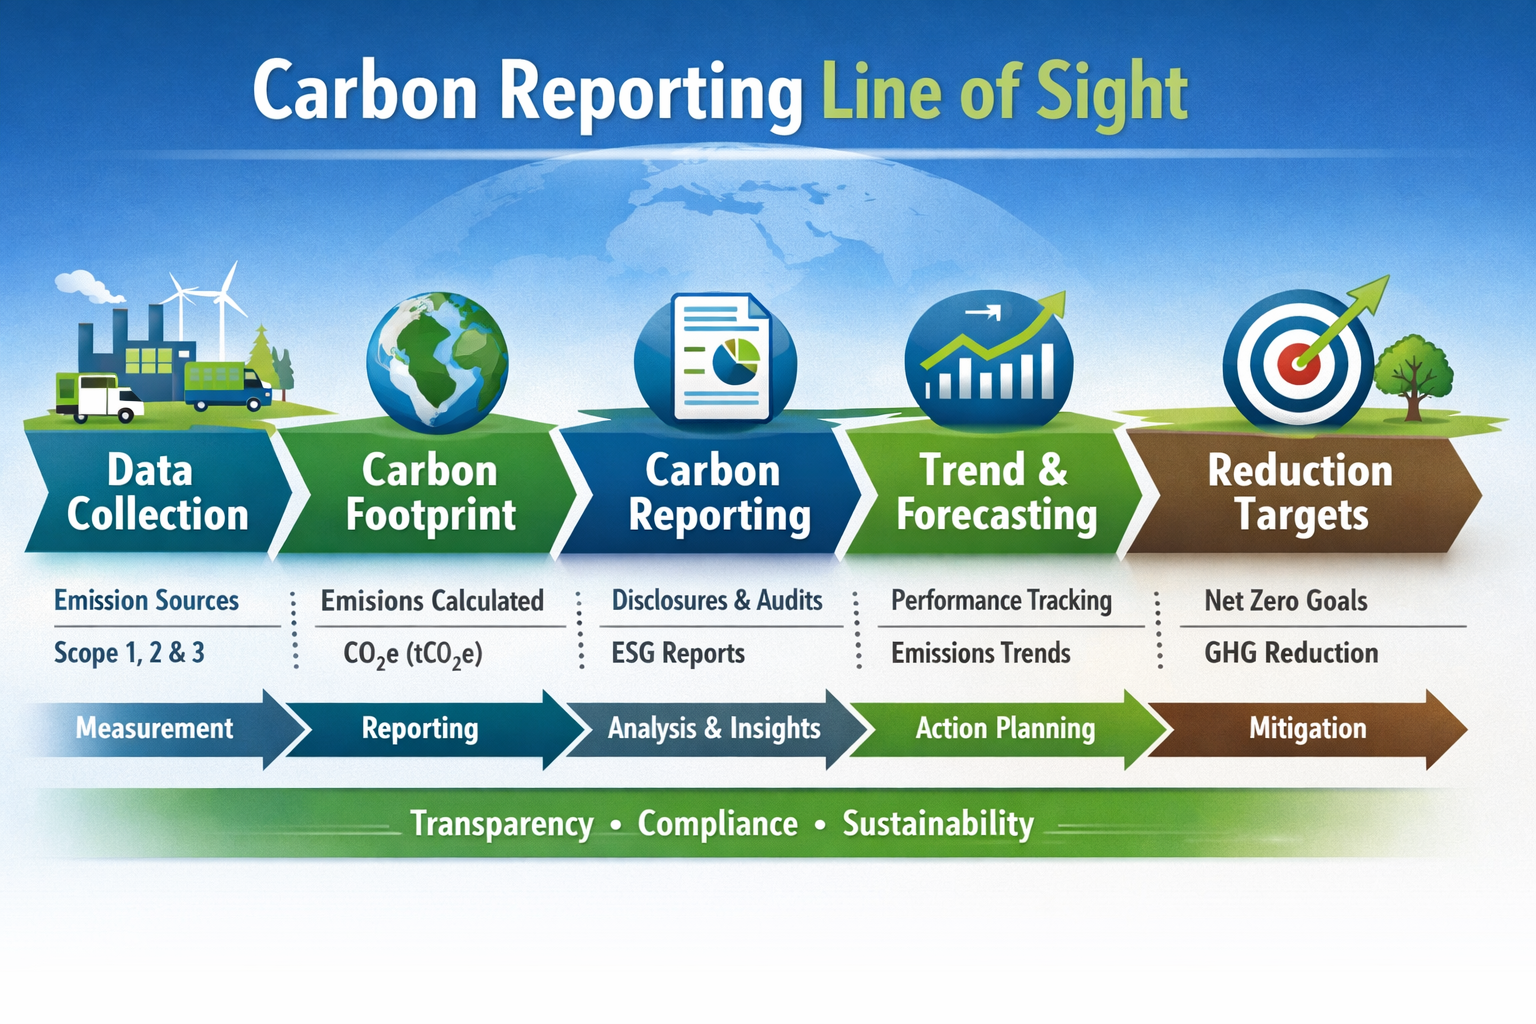
    Carbon reporting estimates are quantified approximations used when primary emissions data is unavailable or impractical to collect. Under the GHG Protocol, estimates are a legitimate and expected part of corporate carbon reporting — particularly for Scope 3 categories. The key requirement is transparency: organisations must disclose their estimation methodologies, data sources, and assumptions, and demonstrate that these are reasonable, consistent, and improving over time.

    Confidence TierData BasisUse CaseDisclosure Approach
    High-confidencePrimary data, verified factorsScope 1, Scope 2, key Scope 3Report as measured data
    DirectionalIndustry averages, spend-basedMost Scope 3 categoriesDisclose method and assumptions
    PlaceholderProxy data, extrapolationsEarly-stage or immaterial categoriesFlag as estimate, plan to improve

    How to Be Honest About ESG Data Without Undermining It

    Carbon Reporting Estimates are not the problem in ESG reporting.

    Pretending they aren’t estimates is.

    Across Scope 1, 2 and 3, every organisation relies on assumptions, proxies and modelled data at some point. That’s not a failure of ambition or capability — it’s a reflection of how complex modern businesses are.

    The organisations that lose credibility aren’t the ones that estimate. They’re the ones that don’t explain what they’ve estimated, why, and how confident they are.

    This playbook sets out how to manage estimates in a way that builds trust — with auditors, boards and stakeholders — rather than quietly eroding it.

    Why Carbon Reporting Estimates Exist (Whether We Like It or Not)

    ESG data is rarely born perfect.

    Meters fail. Supplier data is incomplete. Logistics systems optimise for cost, not carbon. Customers don’t report how they use products. Waste systems vary by geography. Even energy data in Scope 2 often relies on averages and market instruments.

    One ESG lead summed it up neatly:
    “If we waited for perfect data, we’d never report anything at all.”

    That’s true across all three scopes — just in different ways.


    Scope 1: When “Actual” Isn’t Always Actual

    Scope 1 is often described as the easy scope. It’s not.

    Fuel consumption, refrigerant leakage, backup generators — even here, estimates creep in. Missing invoices, blended fuel sources, leakage assumptions and engineering factors all play a role.

    The credibility risk in Scope 1 isn’t estimation — it’s overconfidence.

    When organisations present Scope 1 numbers as flawless, assurance teams tend to look harder. When assumptions are documented openly, scrutiny usually softens.

    Honesty builds confidence faster than precision theatre.


    Scope 2: The Illusion of Certainty

    Scope 2 feels clean because it’s structured. Electricity bills exist. Emission factors exist. Market-based instruments exist.

    And yet Scope 2 is full of judgement calls.

    Location-based or market-based? Which residual mix? How are renewable certificates treated? What happens when data lags reality?

    One finance leader once remarked:
    “We’ve argued about Scope 2 methodology longer than it took us to calculate it.”

    That’s because Scope 2 carbon reporting estimates aren’t about maths — they’re about interpretation.

    Credible organisations are explicit about those choices and consistent over time. That consistency matters far more than picking the “perfect” method.


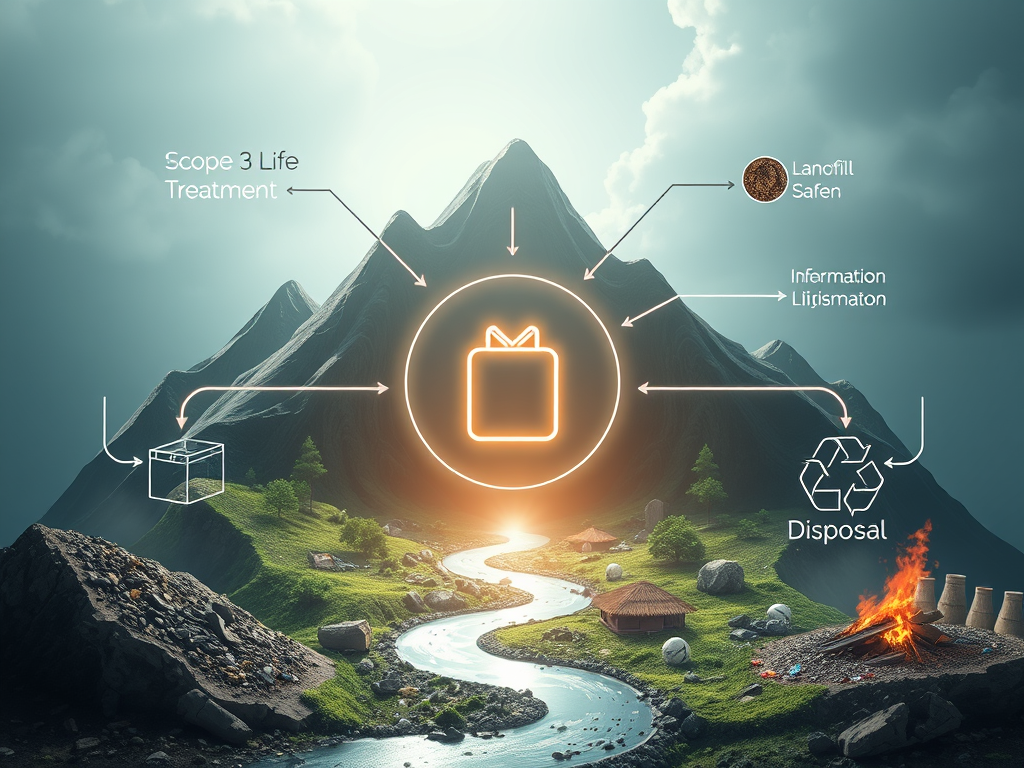
    Scope 3: Where Estimates Are the Norm, Not the Exception

    In Scope 3, carbon reporting estimates are unavoidable.

    Purchased goods rely on spend or average factors. Transport depends on distances and modes. Use-phase emissions depend on behaviour. End-of-life depends on waste pathways no one controls.

    The mistake organisations make isn’t estimating — it’s treating all estimates as equal.

    Leading teams distinguish between:

    • High-confidence estimates

    • Directional estimates

    • Early-stage placeholders

    They don’t hide uncertainty. They classify it.

    One CSO described this shift as “moving from defensive reporting to honest reporting.” The difference was immediately visible to the board.


    The Real Credibility Killer: Undeclared Assumptions

    Assumptions aren’t dangerous. Invisible assumptions are.

    Credibility erodes when:

    • Carbon Reporting Estimates aren’t labelled as such

    • Methodology changes aren’t explained

    • Precision increases without explanation

    • Numbers improve but confidence doesn’t

    Stakeholders don’t expect perfection. They expect clarity.

    Once that expectation is met, conversations become far more constructive.


    What Good Looks Like Across All Scopes

    Organisations that manage Carbon Reporting estimates well tend to do a few things consistently.

    They separate accuracy from confidence. They make data quality visible. They explain why estimates exist and how they plan to improve them. And they resist the temptation to oversell precision.

    One organisation introduced a simple confidence indicator alongside its emissions figures. Assurance discussions became shorter. Board questions became sharper — but fairer.

    Transparency didn’t weaken their position. It strengthened it.


    From Apology to Asset

    The most mature organisations stop treating estimates as something to apologise for.

    Instead, estimates become:

    • A signal of where data maturity needs investment

    • A way to prioritise supplier engagement

    • A roadmap for improvement

    • A conversation starter, not a conversation stopper

    As one CFO put it:
    “I don’t need perfect numbers. I need to know which ones I can trust — and which ones we’re improving.”

    That’s the mindset shift.


    What This Means for You
    If You’re an ESG or Sustainability Manager

    You don’t need to defend estimates — you need to explain them well.

    Clear documentation, visible confidence levels and consistent methodology allow you to maintain credibility even when data is imperfect. That’s what keeps momentum going year after year.


    If You’re a CFO or Finance Leader

    Estimates are acceptable when governance is strong.

    Transparency, consistency and a clear improvement path allow you to sign off numbers you understand — and explain them confidently to the board.


    If You’re a CSO or Board Sponsor

    Credibility doesn’t come from pretending uncertainty doesn’t exist.

    It comes from acknowledging it, managing it, and demonstrating progress over time. That’s what stakeholders increasingly expect.


    What This Looks Like in Horizon ESG

    Horizon ESG’s ESG reporting software is designed to make estimation transparent rather than hidden.

    AI agents can be asked to make estimates – but they always show their workings…and store them in the database next to the number they estimated.

    Assumptions are explicit. Confidence is visible. Improvements are trackable. Estimates become part of the management conversation — not something buried in footnotes.


    The Playbook Mindset

    Estimates are not a weakness in ESG reporting.

    Poorly explained estimates are.

    Organisations that manage estimation with honesty, structure and discipline don’t lose credibility — they gain it. Because in ESG, trust is built not on perfection, but on clarity.

    That’s what good looks like.

    To see how Horizon ESG handles carbon reporting estimates, book a demo. For additional guidance on carbon reporting estimates – follow guidance issued by GHG protocols.

  • Scope 3 End-of-Life Emissions: How to Report 2026

    Scope 3 End-of-Life Emissions: How to Report 2026

    The Carbon Cost of the Last Goodbye

    Scope 3 Category 12 is where the carbon story comes full circle.

    What are Scope 3 Category 12 end-of-life treatment emissions?

    Scope 3 Category 12 end-of-life treatment emissions account for the greenhouse gases released when sold products are disposed of by consumers or downstream users. Under the GHG Protocol, this includes emissions from landfill decomposition, incineration (with or without energy recovery), recycling processes, and composting. The reporting organisation is responsible for estimating these emissions based on the expected waste treatment profiles of markets where products are sold.

    Treatment TypeEmission SourcesRelative IntensityKey Assumption Risk
    LandfillMethane from anaerobic decompositionHighMethane capture rates vary 0-75%
    Incineration (no recovery)CO2 from combustionHighFossil carbon content must be estimated
    Incineration (energy recovery)CO2, offset by displaced grid energyMediumDisplaced energy mix assumption critical
    RecyclingProcess energy for reprocessingLow-MediumActual vs theoretical rates diverge
    CompostingCH4 and N2O from decompositionLowIndustrial vs home conditions vary

    The product has been designed, manufactured, transported, sold, used — and eventually, it reaches the end of its life. At that point, responsibility, which may have felt comfortably distant for a while, has a habit of reappearing.

    Category 12 captures the emissions associated with the end-of-life treatment of sold products: disposal, recycling, incineration, landfill, and recovery. These emissions often feel abstract, remote, and awkwardly downstream — yet they are increasingly scrutinised, particularly where circularity claims are made.

    This playbook sets out how leading organisations approach Category 12 realistically, without pretending they can control waste systems they don’t own — and without ignoring the influence they do have.

    What Category 12 Actually Covers

    Category 12 includes emissions generated once a product is discarded.

    That might involve:

    • Landfill emissions

    • Incineration and energy recovery

    • Recycling and material reprocessing

    • Waste transport and treatment

    • Loss of embedded carbon through disposal

    In simple terms, it’s what happens after the product stops being useful — but before it stops having impact.

    One sustainability lead described it as “the part of the footprint that arrives after everyone’s mentally moved on.” Unfortunately, regulators and stakeholders haven’t.


    Why End-of-Life Is So Difficult to Model

    End-of-life emissions depend on variables that are hard to observe and even harder to predict.

    Products are disposed of differently across countries, regions and customers. Recycling rates vary. Waste infrastructure varies. Consumer behaviour varies. Even the same product can follow very different end-of-life paths.

    We’ve seen organisations attempt to model end-of-life using national averages, only to be challenged on how representative those averages really are.

    The truth is uncomfortable but unavoidable: precision here is limited.


    The Risk of Ignoring Category 12

    Because Category 12 often represents a smaller share of total emissions, it’s tempting to downplay it.

    That’s usually a mistake.

    End-of-life emissions are closely tied to claims around recyclability, circularity and product responsibility. When those claims exist, Category 12 suddenly matters a great deal — especially under scrutiny.

    One organisation found itself fielding difficult questions not because its numbers were large, but because its circularity narrative wasn’t clearly reflected in its end-of-life assumptions.

    The issue wasn’t the maths. It was the mismatch.


    When Circular Economy Meets Accounting Reality

    Category 12 is where sustainability ambition and reporting discipline need to align.

    Design teams may focus on recyclability. Marketing may emphasise circularity. ESG teams must translate those ideas into emissions logic that stands up to review.

    That translation isn’t always comfortable.

    We’ve seen teams discover that a “recyclable” product still ends up in landfill in most markets. The product wasn’t misleading — but the assumption was.

    Category 12 has a habit of revealing those gaps.


    What Good Looks Like for Category 12

    Leading organisations approach end-of-life with realism and transparency.

    They define clear end-of-life scenarios based on credible data sources. They document assumptions explicitly. They avoid over-claiming precision. And they prioritise products where disposal pathways materially affect emissions or reputational risk.

    One manufacturer shared that once they aligned product claims, waste assumptions and reporting language, Category 12 stopped being contentious — even when estimates were involved.

    Confidence came from consistency, not certainty.


    Influence Where It Matters

    While organisations don’t control waste systems, they do influence outcomes.

    They can:

    • Design products for easier recycling

    • Reduce material complexity

    • Improve durability and repairability

    • Support take-back or recovery schemes

    • Provide clearer disposal guidance

    When Category 12 data is fed back into design and packaging decisions, it stops being a reporting afterthought and becomes part of the value chain conversation.

    As one product lead put it: “Once end-of-life showed up in the numbers, design choices felt a lot less theoretical.”


    What This Means for You
    If You’re in Product or Packaging

    Category 12 provides a reality check.

    It helps teams understand how design choices play out at the end of a product’s life — not in theory, but in practice. It’s not about perfection; it’s about making informed trade-offs that reduce waste and embedded emissions over time.


    If You’re an ESG or Sustainability Manager

    End-of-life emissions are rarely exact, but they must be explainable.

    A playbook-led approach gives you defensible assumptions, clear documentation, and a credible narrative for uncertainty. It ensures circularity claims and reported emissions tell the same story.


    If You’re a CFO or Finance Leader

    Category 12 often carries reputational weight disproportionate to its size.

    Clear governance, consistent methodology and transparent assumptions allow you to sign off numbers you understand — and stand behind claims that might otherwise invite challenge.


    If You’re a CSO or Board Sponsor

    Category 12 is where responsibility visibly returns to the organisation.

    Stakeholders increasingly expect businesses to account for what happens at the end of a product’s life, even when control is indirect. A realistic, transparent approach demonstrates maturity and builds trust — especially when sustainability narratives are under scrutiny.


    What This Looks Like in Horizon ESG

    Horizon ESG’s ESG reporting platform enables organisations to model end-of-life emissions transparently, align assumptions with product and packaging strategies, and track improvements over time. Assumptions are explicit, confidence is visible, and end-of-life becomes part of the broader performance conversation.


    The Playbook Mindset

    Scope 3 Category 12 is uncomfortable because it brings responsibility back into view at the very end of the value chain.

    But it’s also where credibility is tested.

    Organisations that approach end-of-life with honesty, discipline and alignment don’t just close the loop — they strengthen the integrity of their entire Scope 3 story.

    That’s what good looks like.


  • Scope 3 Use of Sold Goods: Complete Guide 2026

    Scope 3 Use of Sold Goods: Complete Guide 2026

    You Sold It. The Emissions Didn’t Leave With It.

    Scope 3 Category 11 is where emissions quietly drift out of sight.

    What are Scope 3 Category 11 use-of-sold-products emissions?

    Scope 3 Category 11 use of sold products emissions capture the greenhouse gases generated when customers operate, consume, or use products after purchase. Under the GHG Protocol, this includes direct use-phase emissions (e.g. fuel combustion in vehicles) and indirect use-phase emissions (e.g. electricity consumed by appliances). The reporting organisation must model these emissions over the expected lifetime of each product, using assumptions about usage frequency, energy source, and product efficiency.

    ParameterDefinitionUncertaintyImprovement Strategy
    Product lifetimeExpected years/cycles of useMediumValidate with warranty and return data
    Usage frequencyOperating cycles per periodHighIoT telemetry or customer surveys
    Energy per usekWh or fuel per cycleLow-MediumReal-world testing, not lab specs
    Grid emission factorCO2e per kWh consumedMediumRegional factors for key markets
    Efficiency degradationPerformance decline over lifeHighBuild curves from service data

    The product has been sold. Revenue has been recognised. Responsibility, at least operationally, feels complete. And yet, for many businesses, the largest share of their total carbon footprint is only just beginning.

    Category 11 captures the emissions generated during the use of sold products — often over years, sometimes decades. These are emissions you enable, influence indirectly, and are expected to report, despite having no control over how customers actually behave.

    This playbook sets out how leading organisations approach Category 11 realistically — without pretending they can control end users, and without retreating into vague assumptions.

    What Category 11 Actually Covers

    Scope 3 Category 11 includes emissions from the use phase of products sold by the company.

    That might mean:

    • Energy consumed by appliances, equipment or vehicles

    • Fuel burned by products during operation

    • Electricity used by consumer or industrial goods

    • Ongoing emissions driven by how often, how long and how intensively products are used

    In simple terms: once your product leaves the building, Category 11 begins.

    One product manager described it as “the emissions equivalent of parenting a teenager — you influence early behaviour, but after that, you’re mostly hoping for the best.”


    Why Category 11 Is So Uncomfortable

    Category 11 forces organisations to confront a difficult reality: your biggest emissions may depend on choices you don’t make.

    Usage varies wildly by customer, geography, behaviour and context. Two identical products can generate very different emissions depending on how they’re used, maintained or powered.

    We’ve seen teams attempt to define “average use” based on limited assumptions, only to realise that their average user doesn’t really exist.

    The result is often a set of numbers that look precise, but feel deeply theoretical.


    The Challenge of Modelling the Use Phase

    Unlike transport or procurement, Category 11 is forward-looking by nature.

    It relies on assumptions about:

    • Product lifetime

    • Frequency of use

    • Energy mix

    • User behaviour

    • Maintenance and efficiency degradation

    Each assumption is reasonable in isolation. Together, they compound uncertainty.

    One ESG lead put it bluntly: “We can explain every assumption — but we still wouldn’t bet the company on the result.” That honesty is important, because pretending otherwise rarely survives scrutiny.


    When Engineering Meets ESG (Sometimes Awkwardly)

    Category 11 often pulls ESG teams into unfamiliar territory.

    Engineering teams talk about design specs and efficiency ratings. Sustainability teams talk about emissions factors and reporting boundaries. Marketing talks about customer value. None of them are wrong — but alignment doesn’t happen automatically.

    We’ve seen organisations struggle not because the maths was hard, but because ownership was unclear. Who defines “typical use”? Who signs off the assumptions? Who explains the uncertainty?

    Until those questions are answered, Category 11 tends to drift.


    What Good Looks Like for Category 11

    Leading organisations take a grounded, transparent approach.

    They define a clear use-phase model based on defensible assumptions. They document what is known, what is estimated, and what is out of scope. They prioritise products that drive the largest share of emissions, rather than modelling everything at once.

    Most importantly, they resist the urge to oversell precision.

    One manufacturer shared that once they openly labelled their Category 11 numbers as “modelled, assumption-driven estimates,” assurance conversations became noticeably calmer. Confidence improved, not because uncertainty disappeared, but because it was acknowledged.


    Influence, Not Control

    The real value of Category 11 lies in influence.

    While organisations can’t dictate how customers use products, they can:

    • Improve product efficiency

    • Design for lower energy consumption

    • Provide clearer guidance on efficient use

    • Support transitions to lower-carbon energy sources

    When Category 11 data is linked back to product design and innovation, it stops being a reporting obligation and starts informing strategy.

    A product director summed it up neatly: “Once we could see the lifetime emissions, design trade-offs suddenly mattered a lot more.”


    What This Means for You
    If You’re in Product or Engineering

    Category 11 isn’t about blaming design teams for customer behaviour.

    It’s about understanding how design choices influence lifetime emissions and where efficiency improvements have the biggest impact. A clear Category 11 model gives product teams a carbon lens they can actually use — without pretending to control the user.


    If You’re an ESG or Sustainability Manager

    Category 11 is rarely precise, but it can be credible.

    A playbook-led approach gives you a structured model, documented assumptions, and a defensible narrative for uncertainty. It shifts conversations away from false precision and towards continuous improvement and influence.


    If You’re a CFO or Finance Leader

    Category 11 often represents long-term, off-balance-sheet impact — which makes transparency essential.

    Clear assumptions, consistent methodology and visible governance allow you to sign off numbers you understand, even if they’re modelled. More importantly, it links emissions back to product strategy and investment decisions.


    If You’re a CSO or Board Sponsor

    Category 11 is where long-term credibility is tested.

    Stakeholders increasingly accept that use-phase emissions are complex. What they expect is honesty, consistency and a credible plan to reduce impact over time — through design, innovation and influence rather than wishful thinking.


    What This Looks Like in Horizon ESG

    Horizon ESG’s ESG reporting platform supports Category 11 by enabling organisations to model use-phase emissions transparently, document assumptions clearly, and link emissions back to products, scenarios and improvement pathways.

    The result isn’t artificial precision — it’s decision-grade insight.


    The Playbook Mindset

    Scope 3 Category 11 is uncomfortable because it stretches responsibility beyond the point of sale.

    But it’s also where some of the most meaningful reductions can be influenced.

    Organisations that approach the use phase with realism, discipline and humility don’t just report better — they design better products, make better trade-offs, and build long-term trust.

    That’s what good looks like. Book a demo to see how Horizon ESG can help.

  • Scope 3 Transport Emissions: Reporting Guide 2026

    Scope 3 Transport Emissions: Reporting Guide 2026

    Managing transport emissions that everyone uses…and no-one really owns!

    If Scope 3 Category 1 is uncomfortable, Categories 4 and 9 are awkward.

    What are Scope 3 Category 4 and Category 9 transport emissions?

    Scope 3 Category 4 and Category 9 transport emissions cover the greenhouse gas impact of moving goods through your value chain. Category 4 (upstream transportation and distribution) captures emissions from supplier-to-gate logistics, while Category 9 (downstream transportation and distribution) covers gate-to-customer movements. Under the GHG Protocol Corporate Value Chain Standard, reporting organisations must account for emissions from all third-party carriers, freight forwarders, and distribution centres used in both directions.

    AspectCategory 4 (Upstream)Category 9 (Downstream)
    BoundarySupplier to reporting companyReporting company to end customer
    Included activitiesInbound freight, third-party warehousingOutbound freight, retail distribution, last-mile delivery
    Common transport modesContainer shipping, road haulage, rail freightRoad delivery, parcel carriers, air freight
    Typical data sourcesSupplier invoices, freight forwarder reportsCarrier reports, 3PL data, distribution centre records
    Calculation methodDistance-based (tonne-km) or spend-basedDistance-based (tonne-km) or spend-based
    Key challengeSupplier unwillingness to share freight dataLack of visibility beyond first delivery point

    They sit in that familiar ESG grey area: emissions you rely on, influence indirectly, and are expected to report — but don’t directly control. Transport happens because your business exists, yet responsibility for its carbon footprint is fragmented across suppliers, carriers, contracts and routes that rarely line up neatly.

    This playbook sets out how leading organisations approach Scope 3 Categories 4 and 9 — not as an exercise in logistics perfection, but as a manageable, defensible discipline that improves over time.

    What Categories 4 & 9 Actually Cover

    Category 4 captures upstream transportation and distribution — the movement of goods from suppliers to your operations. Category 9 covers downstream transportation and distribution — the movement of goods from your business to customers, retailers or end points not owned or controlled by you.

    In theory, that sounds simple. In practice, transport emissions are scattered across freight forwarders, shipping lines, last-mile carriers and third-party logistics providers, each with their own data standards and priorities.

    One supply chain manager described it neatly: “The emissions are everywhere, but the data is nowhere.”


    Why Transport Emissions Are So Difficult to Pin Down

    Transport emissions are defined by movement — distance, weight, mode, route, utilisation. That means data often lives in operational systems designed to move goods efficiently, not to explain carbon impact.

    In many organisations, logistics data is optimised for cost and service levels. Carbon is an afterthought, if it’s captured at all.

    We’ve seen teams attempt to reconstruct a year of transport emissions using invoices, shipment records and best guesses. The result is usually a heroic spreadsheet, a very tired analyst, and a number everyone agrees not to look at too closely.


    The Reality of Estimates in Categories 4 & 9

    Most organisations start with distance- or spend-based estimates for Categories 4 and 9. And, as with Category 1, that’s entirely reasonable.

    Estimates provide coverage. They allow organisations to understand scale and direction. They surface which transport modes matter most — air freight rarely hides for long.

    The risk comes when estimates are presented without context.

    One logistics lead summed it up bluntly: “We know this isn’t precise, but we don’t know how wrong it is.” That uncertainty is what undermines confidence, not the use of estimates themselves.


    When Carrier Data Complicates Things

    As logistics providers begin supplying emissions data, a new challenge emerges.

    Carrier-reported emissions often use different assumptions, allocation methods and boundaries. One provider reports well-to-wheel emissions. Another reports tank-to-wheel. A third reports something in between.

    Without standardisation, organisations can end up stitching together numbers that look sophisticated but don’t quite add up.

    More data arrives. Confidence doesn’t necessarily follow.


    What Good Looks Like for Categories 4 & 9

    Leading organisations take a pragmatic approach.

    They start by establishing a clear baseline using consistent assumptions. They identify the transport modes, routes or regions that drive the majority of emissions. They focus engagement on the logistics partners that matter most, rather than attempting to extract perfect data from everyone.

    One global manufacturer shared that once they focused on air freight lanes alone, they unlocked more insight in three months than they had in the previous two years.

    Progress came from focus, not volume.


    Clarifying Ownership Across the Organisation

    Transport emissions sit at the crossroads of sustainability, supply chain, finance and operations — which makes ownership particularly easy to avoid.

    Successful organisations are explicit. ESG defines the methodology. Supply chain teams provide operational insight. Finance ensures governance and consistency. Logistics providers supply data where available.

    When those roles are clear, Categories 4 and 9 stop drifting between functions and start moving forward.


    From Disclosure to Decision-Making

    The turning point comes when transport emissions inform decisions.

    That might mean reviewing air freight policies, re-evaluating distribution networks, or understanding the carbon impact of service-level commitments. The aim isn’t to eliminate trade-offs, but to make them visible.

    A supply chain director put it simply: “Once we could see the carbon cost of speed, conversations changed.” That’s when Categories 4 and 9 start to matter.


    What This Means for You
    If You’re in Supply Chain or Logistics

    Categories 4 and 9 don’t require you to become a carbon accountant. They require clarity.

    A structured approach allows you to understand which routes, modes and decisions drive emissions, without drowning in data requests. Carbon becomes another operational lens — not a distraction, but a tool to support better network and service-level decisions.


    If You’re an ESG or Sustainability Manager

    Transport emissions are rarely perfect, but they can be credible.

    This playbook approach gives you a defensible baseline, a clear improvement pathway, and a way to explain uncertainty without undermining trust. It shifts the conversation from “Is this exact?” to “Is this directionally right — and are we acting on it?”


    If You’re a CFO or Finance Leader

    Categories 4 and 9 often sit outside traditional financial controls — which is exactly why governance matters.

    A structured methodology ensures the numbers you sign off are consistent, explainable and auditable. More importantly, it links emissions back to operational and commercial decisions, where oversight actually makes a difference.


    If You’re a CSO or Board Sponsor

    Transport emissions are visible, emotive and increasingly scrutinised.

    A pragmatic, transparent approach shows stakeholders that the organisation understands where its logistics footprint sits, acknowledges uncertainty, and has a credible plan to improve over time. That combination builds confidence far more effectively than precision theatre.


    What This Looks Like in Horizon ESG

    Horizon ESG’s ESG reporting platform supports this journey by helping organisations establish consistent baselines, layer in carrier-specific data where it adds value, and track data quality over time. Emissions can be linked to routes, modes and partners, making transport a manageable part of the Scope 3 picture.


    The Playbook Mindset

    Scope 3 Categories 4 and 9 are uncomfortable because they expose the hidden mechanics of how goods actually move.

    But they also reveal opportunity.

    Organisations that approach transport emissions with focus, transparency and realism don’t just report better — they make smarter operational decisions.

    And that’s the point. Book a demo to see how Horizon ESG can help.

  • Scope 3 Purchased goods and services discipline

    Scope 3 Purchased goods and services discipline

    Scope 3 Category 1 – Turning Purchased Goods & Services into a Manageable Discipline

    Scope 3 Category 1 is where most ESG programmes quietly lose momentum.

    What are Scope 3 Category 1 purchased goods and services emissions?

    Scope 3 Category 1 purchased goods and services emissions represent the cradle-to-gate greenhouse gases embedded in everything an organisation buys — from raw materials and components to professional services and IT equipment. Under the GHG Protocol, Category 1 typically constitutes the single largest share of a company’s total carbon footprint. Calculation methods range from spend-based estimates using economic input-output factors to supplier-specific primary data.

    MethodData RequiredAccuracyBest For
    Spend-basedProcurement spend by categoryLowInitial baseline, full coverage
    Average-dataMass/units + industry-average factorsMediumCategories with physical quantities
    HybridMix of spend, average, supplier-specificMedium-HighTransitional improvement stage
    Supplier-specificPrimary data from suppliersHighTop suppliers, CSRD double materiality

    Not because organisations lack ambition, but because Purchased Goods & Services sit at the uncomfortable intersection of responsibility and control. The emissions are yours to report, but they sit deep inside supply chains you don’t own, data you didn’t create, and systems you can’t dictate.

    This playbook sets out how leading organisations approach Category 1 in practice — not as a one-off reporting obligation, but as a capability that matures over time.

    Step 1: Accept the Reality of Category 1

    For most organisations, Category 1 represents the largest share of their carbon footprint. Sometimes uncomfortably so.

    The first and most important shift is accepting that imperfect data is inevitable at the start. Waiting for perfect supplier data before acting usually leads to delay, frustration, and lost credibility.

    One sustainability lead described their first Category 1 calculation as “accurate enough to be honest, but not enough to be proud of.” That’s exactly where most organisations begin — and that’s fine. The goal at this stage is transparency and coverage, not precision.


    Step 2: Build a Defensible Baseline

    Spend-based methods are often the only practical way to establish an initial Category 1 baseline. They’re structured, auditable, and allow organisations to move quickly without overloading suppliers.

    Used properly, spend-based data provides a common language across ESG, finance and procurement. It allows teams to understand scale, direction, and relative impact — even if the numbers are broad.

    The mistake is mistaking this baseline for the final answer.

    As one CFO put it during a board review: “I can stand behind this number, but I wouldn’t want to manage a strategy off it.” That instinct is correct. A baseline exists to be improved upon, not defended indefinitely.


    Step 3: Focus Where It Matters Most

    Category 1 becomes manageable the moment organisations stop treating all suppliers equally.

    Leading teams identify the suppliers and categories that drive the greatest share of emissions or risk, and focus their effort there first. This approach reduces noise and creates space for more meaningful engagement.

    A procurement team once shared that when they narrowed their supplier engagement from hundreds to a focused group of twenty, conversations shifted almost overnight — from generic questionnaires to genuine discussions about materials, processes and alternatives.

    Progress accelerated, not because the data was perfect, but because attention was finally in the right place.


    Step 4: Improve Data Quality Gradually…and Openly

    As supplier-specific data begins to replace estimates, confidence doesn’t automatically increase.

    Supplier data often arrives with gaps, mixed methodologies and varying levels of assurance. Without visibility into how figures were produced, organisations can find themselves with more numbers but less trust.

    Best practice organisations make data quality explicit. They track how much of Category 1 is estimated, how much is supplier-specific, and how methodologies evolve over time. Improvement becomes visible. Conversations become grounded. Assurance becomes far less adversarial.


    Step 5: Clarify Ownership Across the Organisation

    Category 1 stalls fastest when ownership is vague.

    Successful organisations are clear: ESG teams define methodology and targets, finance ensures governance and spend integrity, and procurement enables supplier engagement. Each function plays a distinct role, and accountability is explicit.

    One organisation described its early Category 1 efforts as “everyone agreeing it mattered, but no one knowing who owned it.” Once roles were clarified, progress followed — not because the data suddenly improved, but because decisions finally had owners.


    Step 6: Move From Reporting to Managing

    The real value of Category 1 emerges when emissions stop being something explained once a year and start becoming something used.

    That shift happens when carbon data is linked to suppliers, categories and decisions, and appears alongside cost, risk and performance metrics. Not as a moral signal, but as operational intelligence.

    A sourcing lead summed it up simply: “The moment carbon appeared next to price, behaviour changed.” That’s when Category 1 stops being theoretical and starts influencing outcomes.


    What This Means for You
    If You’re in Procurement

    A structured Category 1 approach replaces scattergun sustainability requests with focused, strategic engagement.

    Instead of asking every supplier for everything, procurement teams can prioritise the relationships that matter most and use carbon data to support smarter sourcing decisions. Carbon becomes another lens on supplier performance — not an administrative burden, but a practical input into negotiations and long-term partnerships.


    If You’re an ESG or Sustainability Manager

    This playbook removes the pressure to achieve perfection too early.

    It provides a defensible baseline, a clear improvement pathway, and a way to talk openly about uncertainty without undermining credibility. By making data quality visible, the conversation shifts from “Are these numbers right?” to “Are these numbers improving, and are they driving action?”

    That shift is often what sustains momentum year after year.


    If You’re a CFO or Finance Leader

    Category 1 may never feel comfortable, but it can become governable.

    A structured approach ensures the numbers you sign off are transparent, consistent and auditable — even when estimates are involved. More importantly, it creates a clear line of sight between emissions, spend and decision-making.

    That’s what turns ESG from a compliance obligation into a performance conversation the board can engage with.


    If You’re a CSO or Board Sponsor

    Category 1 is where credibility is built.

    Stakeholders increasingly understand that Scope 3 is complex. What they look for now is honesty, control and progress. A playbook-led approach demonstrates that the organisation understands its biggest impacts, acknowledges data limitations, and has a clear plan to improve over time.

    That combination — transparency plus direction — is what builds trust.


    What This Looks Like in Horizon ESG

    Horizon ESG’s ESG reporting platform is designed to support this journey end to end.

    Organisations can establish a clear baseline, layer in supplier-specific data where it adds value, track data quality over time, and link emissions directly to suppliers, categories and decisions. Assumptions are explicit, confidence is visible, and progress is measurable.

    Most importantly, Category 1 becomes something teams can work with — not work around.


    The Playbook Mindset

    Scope 3 Category 1 is uncomfortable because it exposes complexity and dependence. But it’s also where the greatest opportunity for impact sits.

    Organisations that treat Purchased Goods & Services as a living capability — not a static disclosure — don’t just report better. They operate better, make stronger decisions, and build credibility that stands up to scrutiny.

    That is what good looks like. Book a demo to see how Horizon ESG can help.

  • Scope 2 Emissions Reporting: The Challenges Most Teams Underestimate

    Scope 2 Emissions Reporting: The Challenges Most Teams Underestimate

    What are the challenges of Scope 2 emissions reporting?

    Scope 2 emissions are indirect greenhouse gas releases from the generation of purchased electricity, steam, heating, and cooling consumed by the reporting organisation. The GHG Protocol requires dual reporting using both the location-based method (grid-average emission factors) and the market-based method (supplier-specific factors, energy attribute certificates, or residual mix factors). This dual approach creates complexity around methodology selection, data sourcing, and year-on-year comparability.

    AspectLocation-BasedMarket-Based
    Emission factor sourceGrid-average for region/countrySupplier-specific or residual mix
    Reflects renewable procurementNo — uses average grid mixYes — via EACs, PPAs, tariffs
    Year-on-year comparabilityStable — grid factors change slowlyVolatile — depends on contract renewals
    Data availabilityHigh — published by IEA, agenciesVariable — depends on supplier
    GHG Protocol requirementMandatoryMandatory (dual reporting)

    Scope 2 emissions are often treated as the simplest category in a GHG Protocol inventory. Purchased electricity goes in, an emission factor comes out, and the number lands in a report. In practice, Scope 2 is where methodology choices, data gaps, and procurement decisions intersect in ways that catch even experienced sustainability teams off guard. The dual reporting requirement alone introduces a layer of complexity that most organisations underestimate until they are mid-way through their first assurance cycle.

    If you have already worked through your Scope 1 reporting challenges, you may assume Scope 2 will be more straightforward. This article explains why that assumption rarely holds, and what to do about it.

    What are Scope 2 emissions?

    Scope 2 covers indirect emissions from the generation of purchased energy that the reporting organisation consumes. This includes electricity, steam, heating, and cooling. Unlike Scope 1 emissions, which arise from sources the organisation owns or controls, Scope 2 emissions occur at the power station or district heating plant — not on your premises. What makes them yours is the act of purchasing and consuming that energy.

    The GHG Protocol Scope 2 Guidance (2015) established that companies must report Scope 2 using two methods: location-based and market-based. This dual requirement is the source of most of the complexity that follows.

    Location-based vs market-based: why dual reporting creates confusion

    The location-based method multiplies energy consumption by the average grid emission factor for the region or country where consumption occurs. It reflects the physical reality of the grid that serves your sites. The market-based method, by contrast, uses emission factors drawn from contractual instruments — supplier-specific data, energy attribute certificates (EACs), power purchase agreements (PPAs), or, where none of these exist, the residual mix factor for the relevant market.

    In theory, both methods answer the same question: what are the emissions associated with your electricity use? In practice, they can tell very different stories. A company that procures renewable energy certificates may show a significant reduction under the market-based method while its location-based figure remains flat or even increases as grid factors are updated. This divergence is not an error — it reflects the difference between contractual claims and physical grid reality — but it creates awkward questions from investors, auditors, and internal stakeholders who expect one clear number.

    The confusion deepens when teams must decide which figure to use for target-setting, which to feature in annual reports, and how to explain the gap between the two. Frameworks such as the CSRD and ESRS standards have their own preferences, and SBTi requires market-based for tracking progress against approved targets. Getting this wrong does not just affect one number — it cascades through every downstream disclosure.

    The renewable energy procurement trap

    Renewable energy procurement is the primary mechanism for reducing market-based Scope 2 emissions. But the landscape of instruments is layered and not every claim survives scrutiny.

    Unbundled energy attribute certificates — such as Guarantees of Origin (GoOs) in Europe, REGOs in the UK, and I-RECs in other markets — are the most common route. They are also the most scrutinised. An unbundled certificate is purchased separately from the underlying electricity, meaning the buyer has no direct relationship with the generating asset. Critics argue that unbundled certificates do little to drive new renewable capacity. From a reporting standpoint, they are currently accepted under the GHG Protocol’s Scope 2 Guidance quality criteria, but their credibility is under increasing pressure from assurance providers, ESG rating agencies, and forthcoming updates to reporting standards.

    Power purchase agreements (PPAs) — both physical and virtual — represent a stronger claim. A physical PPA delivers electricity from a specific asset to the buyer. A virtual (or financial) PPA is a contract for difference that does not deliver physical power but does generate bundled certificates. PPAs are operationally complex, require long-term commitments, and introduce financial risk, but they are increasingly viewed as the gold standard for credible renewable procurement.

    Green tariffs offered by energy suppliers sit somewhere in between. Some are backed by dedicated generation assets and bundled certificates; others simply pass on unbundled certificates as part of the supply contract. The quality varies significantly, and sustainability teams need to interrogate the underlying instruments rather than relying on a supplier’s marketing claims.

    The practical risk is clear: a company that reports zero market-based Scope 2 emissions on the strength of unbundled certificates may face challenges during limited or reasonable assurance engagements. Auditors will ask for certificate evidence, check retirement records, confirm temporal and geographic matching, and assess whether the instruments meet the GHG Protocol’s quality criteria. Any gap in the evidence trail can result in qualified findings or material restatements.

    Multi-site and multi-country challenges

    Scope 2 reporting becomes substantially harder as the number of sites and jurisdictions increases. Each country — and in some cases, each sub-national grid region — has its own grid emission factor. Organisations operating across Europe, Asia, and North America may need to source and apply dozens of different factors, each with its own update cycle, data provider, and methodology.

    Grid factor sourcing is the first hurdle. The IEA publishes country-level factors, but many jurisdictions offer more granular data. Using the wrong factor — or the right factor from the wrong year — introduces errors that compound across a large portfolio. Teams must also decide whether to use generation-based or consumption-based factors, and whether to apply national or regional values where sub-national data exists.

    Data collection from landlords and shared buildings is a persistent operational challenge. Many organisations lease office space in multi-tenant buildings where electricity is included in the service charge. In these cases, metered consumption data may not be available, and teams resort to estimated splits based on floor area, headcount, or contracted capacity. These estimates are acceptable when clearly disclosed, but they weaken the precision of the overall inventory and are flagged routinely during assurance.

    Estimated vs metered consumption is a data quality issue that runs through the entire Scope 2 calculation. Where actual meter readings exist, the figure is defensible. Where estimates are used — whether from billing data, benchmarks, or pro-rata allocation — the uncertainty increases. Best practice is to track and disclose the proportion of Scope 2 data that is metered versus estimated, giving report users a clear picture of underlying data quality.

    Year-on-year comparability issues

    One of the most underappreciated challenges in Scope 2 reporting is maintaining comparability across reporting periods. Several factors can cause year-on-year fluctuations that have nothing to do with actual changes in energy consumption or operational efficiency.

    Grid factor updates are the most common culprit. When a country updates its grid emission factor — reflecting changes in the national generation mix — every location-based Scope 2 figure for that country shifts, including the base year. If the reporting organisation does not restate its baseline, the trend line becomes misleading. A company might appear to have increased emissions simply because the grid factor was revised upward, even though its actual electricity consumption fell.

    Contract renewals affect the market-based method. A company that held a PPA or green tariff in one year but switched to a standard grid supply the next will see its market-based figure jump — not because of any operational change, but because of a procurement decision. Conversely, signing a new renewable energy contract can collapse market-based emissions overnight. Both scenarios require clear narrative disclosure to avoid misleading readers.

    Restating historical data is sometimes necessary but always uncomfortable. The GHG Protocol’s base year recalculation policy applies to Scope 2 just as it does to Scope 1, but the triggers are more frequent: acquisitions, disposals, changes in grid factors, or methodological corrections can all require restating prior years. Organisations that lack a clear base year policy — or that restate without adequate disclosure — risk undermining the credibility of their entire emissions trajectory.

    What good Scope 2 reporting looks like

    Strong Scope 2 reporting does not require perfection. It requires transparency, methodological consistency, and a clear evidence trail. The following checklist reflects what assurance providers and informed stakeholders expect to see:

    • Dual reporting — both location-based and market-based figures presented separately, with clear labels and no conflation of the two methods.
    • Emission factor disclosure — sources, vintage, and geographic scope of all grid factors and market-based instruments used, documented and version-controlled.
    • Renewable energy evidence — certificate retirement records, PPA contract references, or green tariff documentation retained and audit-ready for every market-based claim.
    • Data quality indicators — the proportion of consumption data that is metered vs estimated, disclosed at site level or aggregated with explanation.
    • Base year policy — a written policy defining when and how the base year is restated, applied consistently and disclosed in the report.
    • Narrative context — explanation of significant year-on-year changes, including whether variances are driven by activity changes, factor updates, or procurement decisions.
    • Multi-site consistency — a single methodology applied uniformly across all geographies, with deviations documented where local data constraints require them.
    • Alignment with frameworks — confirmation of which GHG Protocol guidance version is followed, and how the Scope 2 figures feed into CSRD, SBTi, CDP, or other disclosure commitments.

    Meeting this standard consistently across reporting cycles is not trivial, particularly for organisations with large, distributed property portfolios or complex energy procurement strategies. But it is achievable with the right systems, processes, and governance in place.

    How Horizon ESG simplifies Scope 2 reporting

    Scope 2 reporting does not have to be a quarterly scramble of spreadsheets, landlord emails, and manually applied emission factors. Horizon ESG’s carbon reporting platform is built to handle the specific challenges outlined in this article: dual-method calculations, multi-country grid factor management, renewable energy instrument tracking, and automated base year recalculation.

    The platform maintains an up-to-date library of location-based and market-based emission factors across all major jurisdictions, applies them automatically based on site location and contract data, and generates the audit trail that assurance providers require. For organisations managing Scope 2 across dozens or hundreds of sites, this replaces fragmented manual processes with a single, consistent workflow.

    If your team is spending more time assembling Scope 2 data than analysing it, that is a process problem with a technology solution. Explore the carbon module or read more about best practice ESG reporting software to see how it fits into your broader reporting workflow.

Book Your Free Demo